This is the user documentation for JManEx, a Java program for exploring the Mandelbrot Set and associated Julia Sets. JManEx allows you to examine portions of the Mandelbrot Set, zoom in where you'd like, adjust the display colors, save your results, and more. While JManEx is far less sophisticated than mature fractal rendering programs like Fractint or Fractal-Explorer, it is very easy to use and runs anywhere that supports the Java 2 platform.Contents:
- The Basics:
- Getting Started
- Basic operations (zooming, choosing colors)
- Using the Presets
- Mandelbrot Set Computation Settings
- Saving Images
- Julia Sets: selecting and rendering
- Julia Set Computation Modes and Settings
- Using JManEx as an Applet
- Advanced stuff:
- Saving and Loading Parameters
- Color mapping modes
- Using the Gradient Editor
- Mathematical Background & Implementation Notes
- Links and References
About JManEx
JManEx is a freeware program. You are free to use, redistribute, and modify it. The source code of JManEx is available from its home page.About this Documentation
The Mandelbrot Set and Julia Sets are examples of mathematical objects that most people call fractals. This means that they exhibit essentially infinite complexity, and that they have some form of self-similarity across a range of scale. This guide is not meant to be an introduction to the general topic of fractals. If you would like to learn more about fractals, visit some of the sites listed in the Links section.This guide is easiest to use when you have JManEx open and running right in front of you. It can be read by itself, but it doesn't have enough screen-shots to really tell you what is going on. So, read the Getting Started section, grab a copy of JManEx, and then work through the rest of the guide.
This section of the guide gives you instruction on how to use the fundamental features of JManEx, and how to save the beautiful pictures that you create.Getting Started
In order to run JManEx as an application on your computer, you will need the Java 2 Runtime Environment (JRE) or Java 2 Development Kit (JDK) installed. Some operating systems have the JRE pre-installed, but most do not. You can download the JRE for Windows, Solaris, or Linux from Javasoft: JRE 1.4. For other platforms, check this list. Note: JManEx requires Java 1.3.0 or later, but works best with 1.4.
Running JManEx
Once you have Java properly installed, you should be able to run JManEx. To run it, you must have the jmanex.jar distribution file. This is the only file you need. You can then run the JManEx program two ways:OR
- Double-click on the jmanex.jar file (should work, usually...)
When JManEx starts, it will pop up a Mandelbrot display window and begin computing the basic Mandelbrot Set image. On a typical computer, the basic image takes about 5-15 seconds to compute.
- Cd to the directory where you put jmanex.jar, and run it like this:
java -jar jmanex.jarThe Mandelbrot display window is shown below, with its four parts labelled. Click on the image to see it full-size.
Color Display Notes
Internally, JManEx uses 24-bit color for everything. Thus, it works best if your desktop display is set to use 24-bit color or better.JManEx will work in 16-bit 'High Color', but it won't look very good.
- Windows: Use the Display control panel (or Desktop Properties) to set your display to "True Color (24 bit)" or "True Color (32 bit)".
- MacOS: Set your desktop color to "Millions of Colors".
- Linux/Unix: Configure your X server to use the 24-bit TrueColor model.
Basic Operations
JManEx was designed to make the most common operations simple. With the Mandelbrot Set, the most common things to do are zoom in on areas of interest, and fiddle with the image display. The sub-sections below tell you how to perform several simple operations.Zooming In
To zoom on a part of the Mandelbrot Set, position the mouse pointer in the display window near the part you want to zoom in on. Then, press and hold down the first (left) mouse button, and drag out a rectangle around the area you want to view. A rubber-band rectangle will appear over the picture while you drag. If the rectangle doesn't end up where you wanted, just release the mouse button and try again. When you've positioned the zoom rectangle where you want to zoom in, click on the big "GO!" button near the top left of the Mandelbrot display window (or pick GO! from the display right-mouse menu).JManEx displays parts of the Mandelbrot display as it computes. If you see that your image is not turning out the way you wanted, you can stop the computation by clicking the the "Stop" button.
Zooming Out
To zoom back out, you typically use the display menu. Right-click (or ALT-click on the Mac) anywhere on the Mandelbrot display, and the display menu will pop up. Three of the choices are good for zooming out:
- Choose "Zoom out 1" to zoom out by a factor of 2.
- Choose "Zoom out 2" to zoom out by a factor of 20.
- Chooze "Home (full set)" to zoom out to the entire Mandelbrot Set.
Changing the Image Size
You can change the size of the Mandelbrot image simply by resizing the Mandelbrot display window. Note that any resizing must, and will, initiate a recomputation. You can also choose several standard sizes from the Set Image Size menu under the main View menu.Changing Colors
The simplest way to change the colors of your Mandelbrot display is to choose a new color gradient from the list of gradient presets. The snapshot at right shows how to do this (Windows view): simply click on the little down-pointing arrow under the gradient sample bar. There are about a dozen presets, each with a descriptive name like "Green-Banded" and "Double Rainbow". Simply choose a new gradient, and the colors of your Mandelbrot image will change automatically. It is also possible to edit the gradients and create your own, that is covered in the Advanced section below.
Another way to fiddle with the colors is to change the color cycling. Immediately to the left of the gradient sample bar, is the "Cycles" dial. Click on the left arrow "<" to use fewer cycles or on the right arrow ">" to use more cycles.
Using the Presets
JManEx includes over 30 presets of beautiful places in and around the Mandelbrot Set. To view one of these presets, simply select one of the items from the pull-down listed labeled "Places:", then click on the "GO!" button. The button at right shows how to do this (Linux view). Many of the presets include their own special color gradients; if you like that gradient, you can keep using it for your own images.
Unfortunately, it is not yet possible to add your own presets. However, you can save your parameter settings in a file for later reuse, as described Advanced section below.
Mandelbrot Set Computation Settings
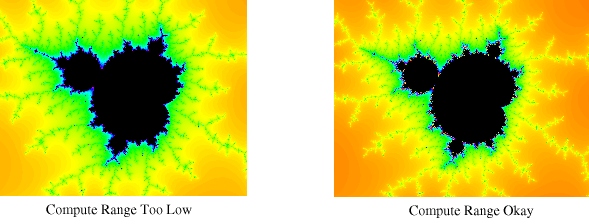
The computation that produced the Mandelbrot Set display essentially assigns an number from 0 to K to every pixel in the image. This value K is called the escape limit or the compute range. Different values of the compute range will produce different images, because the range 0 to K is mapped into the entire selected gradient. Also, a higher compute range value implies more accurate results, at the cost of longer compute time.JManEx allows you to set the compute range. To select a compute range, choose a value from the "Compute range" sub-menu of the Edit menu. Usually, the more you zoom in, the large a compute range you'll want to use. (JManEx cannot zoom in by more than about 5 trillion times, so the set of available compute ranges should be quite adequate.) You'll know that the compute range is too low when the details of your picture start getting blotchy or indistinct, as shown in the example below.
Saving Images
JManEx allows you to save your Mandelbrot (and Julia) image in a variety of formats. If you have Java 1.4b2 or later installed, you can save in Targa (.tga), Portable PixMap (.ppm), JPEG (.pjg), or Portable Network Graphics (.png) formats. If you have an older version of Java installed, you can only use .tga and .ppm. The Targa format should be your choice if you want to edit the image in an image editor (like PhotoShop or PhotoPAINT or The GIMP). The JPEG format or PNG format should be used for web pages. The PPM format is useful if you want to use Unix batch tools to process your image. JManEx does not support GIF, and GIF is not suitable for Mandelbrot images.To save an image, simply select one of the "Save Image as format.." items from the File menu. A file browser dialog will pop up to allow you to select the folder in which to save the file, and the name for the file.
Note that JManEx cannot load images, it can only create them. If you want to save the settings you used to create a particular Mandelbrot image, see the Saving Parameters section, below.
Julia Sets: Selecting and Rendering
Every point in or around the Mandelbrot Set corresponds to a particular Julia Set. The mathematics required to render a Julia Set are similar to those for a Mandelbrot Set, so JManEx supports both of them. To view the Julia Set corresponding to any particular point on the Mandelbrot Set, follow these steps:A Julia display window will pop up, and immediately compute a 'points' view of your selected Julia Set using the default colors and parameters. The Julia display window is shown below; click on the image to see it full-size.
- Double-click on a spot in the Mandelbrot Set display.
- Select "New Window >" and "Julia Window.." from the File menu.
Julia Set Modes and Computation Settings
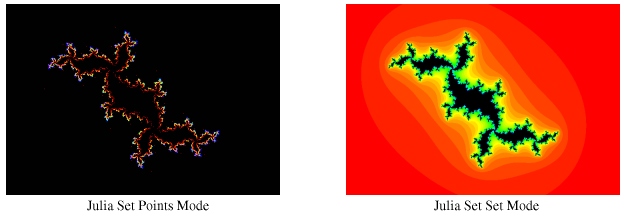
The Julia Set display has two modes: points mode and set mode. There following two subsections explain the two modes and the settings that apply to them.Points Mode
In points mode, JManEx uses the inverse of the usual Julia Set polynomial to try to find the inverse orbit mapping, which usually produces a nice picture of the border or coast of the Julia Set (algorithm adapted from code by Mark McClure and the MIIM algorithm in Peitgen & Richter). This calculation is usually pretty fast, and makes very distinctive pictures like the one shown in the snapshot above.There are two parameter values you can adjust for points mode: the number of points to try (max count), and the maximum sum of arrivals per pixel to permit (max sum). The higher you set these parameters, the longer the computation will take. Set these parameters by choosing items from their respective sub-menus off the main Edit menu.
Note: it is possible to zoom in on a points mode picture, but the algorithm is not well-adapted to that operation, and the results are usually poor.
Set Mode
The Julia set mode picture is a mapping of the escape time for points in and near the Julia Set, using the same algorithm that is used for the Mandelbrot Set. These pictures tend to be more colorful but less intricate.There is only one parameter value you can adjust for the set mode: the compute range. This parameter is exactly analogous to the Mandelbrot compute range parameter, but lower values are usually more satisfactory.
This picture below shows the same Julia set, the one for the seed point -0.20236-0.8i, in points mode and set mode.
Using JManEx as an Applet
JManEx will run as a Java2 applet. That means you must have the Java 2 runtime loaded, and the Java plug-in installed in your web browser. If you have these things, you can run JManEx as an applet here.When you use JManEx as an applet, you cannot save images, nor can you save or load parameters. Everything else works, though.
This section of the guide describes some advanced topics that are not needed by all users of JManEx. Because JManEx is such a simple Mandelbrot Set exploration program, it does not have many advanced features yet.
Saving and Loading Parameter Sets
JManEx allows you to save most of the settings that generated a particular image, Mandelbrot or Julia, in a JManEx Data (.jmxd) file. You can load these files into JManEx later, or on another computer, and recompute the image. (Because .jmxd files contain only settings data, they are quite small. However, they are Java-specific data, so you cannot edit them with any tool other than JManEx.) Only the following aspects of an image are saved in the .jmxd file:To save your settings, just select "Save data.." from the File menu. A file dialog will pop up, use it to select the folder and name under which you will have the data. The file name must end in .jmxd.
- The selected rectangle (coordinate)
- The seed point (Julia Sets only)
- The compute range
- The max sum and max count (Julia Sets only)
- The color gradient
To load saved settings, select "Load data.." from the File menu. If the settings can be displayed in the current window, they will be, otherwise JManEx will pop up a new window for the display.
Color Mapping Models
Every Julia or Mandelbrot set image that JManEx generates is represented internally by a rectangular array (mesh or matrix) of integers. These integers always range from 0 to K, where 0 is the special value for 'interior' and 1 through K are mapped into the selected 'exterior' gradient. The mapping from is normally linear, but JManEx allows you to adjust it because sometimes that results in a nicer picture. The mapping modes available in this version of JManEx are listed below. To select a mapping mode, simply choose one from the "Mode:" pulldown in the control panel.Usually, Linear, Reversed, and Sqr-root are the best to use.
- Linear
Maps 1..K into the gradient evenly, left to right.- Reversed
Maps 1..K into the gradient evenly, right to left.- Squared
Maps 1..K into the gradient left to right, emphasis toward the left.- Sqr-root
Maps 1..K into the gradient left to right, emphasis toward the right.- Rev-square
Maps 1..K into the gradient right to left, emphasis toward the right.- Rev-sqrt
Maps 1..K into the gradient right to left, emphasis toward the left.Using the Gradient Editor
JManEx is equipped with a sophisticated design interface for making your own gradients. To pop up that interface, select the "Edit.." button labeled exterior on the far right of the control panel.The gradient editor is composed of several parts, identified in the illustration below. In general, you use the various segment controls to manipulate the gradient preview. When you've adjusted the gradient preview to your liking, you can apply the new gradient to your Julia Set or Mandelbrot Set image with the OK or Apply buttons. To pop down the gradient editor and discard your changes, use the Dismiss button.
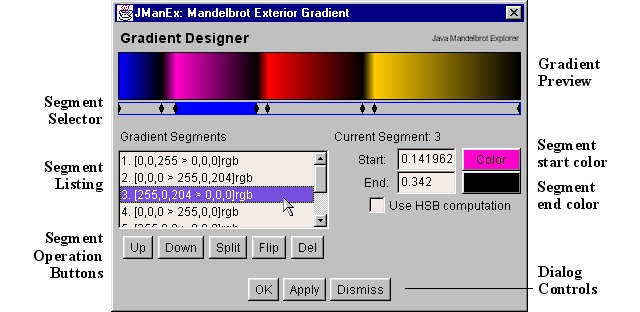 To edit a gradient, use these steps:
Unfortunately, JManEx does not support saving your gradient permanently as a preset. [However, you can edit the presets in another way. First, unpack the jmanex.jar file using this command: jar xvf jmanex.jar. Then, run the gradients presets editor with this command: java GradPresetsEditor gradients.dat. Note: after you have done this, you must run JManEx with the command java JManEx instead of the command given above.]
- Select a segment by clicking on it in the Segment Selector or in the Segment Listing.
- Change the Start: and End: colors, and checking or unchecking the 'Use HSB' box.
- Move the segment around in the gradient with the "Up" and "Down" operation buttons.
- Create new segments by splitting existing ones with the "Split" operation button.
- Remove segments you don't like by using the "Del" operation button.
- Change the boundaries between segments by dragging the little black separators in the Segment Selector.
Mathematical Background and Implementation Notes
The Mandelbrot Set and Julia Sets rendered by JManEx are based on two simple ideas: the complex plane, and iterated application of a function.The Mandelbrot Set is really quite simple: is the set of complex parameter values c for which the results of the iterated application of the function z2 + c stays small forever (when z0 = 0+0i). That's the knobbly looking black area in the center of the initial JManEx display: the complex numbers that are actually members of the Mandelbrot Set. [To be more technical, the members of the Mandelbrot Set are those complex numbers c for which the magnitude |zn| is less than 2+|c| for large n.] The fascinating thing about the Mandelbrot Set is that it is fractal, no matter how far you zoom in on the boundary of the Mandelbrot Set, it stays complicated and wiggly -- it never smooths out. In fact, people have zoomed in on the Mandelbrot Set by magnifications of more than 101500x, and they still see the buds and knobs and all the complex features of the full Set.
- The Complex Plane
A complex number consists of two parts: a real part and an imaginary part. Each part is a more familiar number, like 7.1 or -0.53. In more conventional notation, a complex number z = a + bi , where a is the real part, and b is the imaginary part (and i is the square root of -1, of course). Since a complex number has these two independent parts, we can depict the space of all complex numbers as a plane: the complex plane. The image below shows a simple depiction of this idea.
All the pictures of the Mandelbrot Set and Julia Sets are shown on this plane. For more information about complex numbers, visit purplemath.com.- Iterated application of a function
A function is just a mathematical expression that takes some variables, and delivers a value. A function f(x,y), for example, might take two numbers x and y as input variables, and deliver their product as its result. We could then write the function as f(x,y) = x * y. A function of complex variables is simply a function that takes one or more complex numbers as its variables, and delivers a complex number as its result.
Now, it is easy to see how to apply a function to one variable. Let's take a complex function g, where g(z)=z2 + c. The value c is called a parameter of the function, and we get to pick a value for it.
Iterated application of a function simply means applying the function to a variable, then applying the function again to the result, and then again, and so on. Since the input variable is a complex number, and the result is a complex number, too, we can apply the function as many times as we'd like. It is customary, in that case, to number the input variable and the answers as follows: z0 is the initial input variable value, z1=g(z0), z2=g(z1), and so on. When you iterate the application of a function, the result can sometimes get very big very fast.When investigating the Mandelbrot Set with a computer program, you simply choose an area of the complex plane, and put a mesh over it. The holes in the mesh are the pixels on the computer screen. Then, for each such pixel, you figure out what complex value c it corresponds to. Then, you iterate the function z2 + c on that value, and see how big the results get. If the results stay small for many many iterations, you decide that the number c is a member of the Mandelbrot Set.
Now, that explains the Mandelbrot Set itself, but what about the beautiful colorful regions around it? There are a number of ways to visualize the numbers that don't quite manage to be members of the Mandelbrot Set, but JManEx just uses the simplest one: escape time. The method is quite simple. When iterating the function z2 + c for a particular value of c, you keep track of how many iterations you've done. The number of iterations it takes for the result to start getting big is the escape time. [More technically, the escape time tc for the parameter c is the smallest integer such that |zt| > 2+|c|. ] Now, if you have a palette or range of colors, you just use t to pick a color, and use it to color the pixel on the computer screen.
A Julia Set is related to the Mandelbrot Set, because they both use the same function. Julia Sets use the function in a slightly different way, however. The important thing about the relationship between them is that there is one Mandelbrot Set for the whole complex plane, but there is one Julia Set for every point in the complex plane! (that's a lot)
To figure out the membership of a Julia Set for a particular complex value c, we use iterated application of the function z2 + c again. For the Mandelbrot Set, we used z0=0+0i . For a Julia Set, we try lots of different values for z0. The members of the Julia Set for a particular complex value c are all those values of z0 for which the the iterated application of the function stays small.
...need more here...
There are LOTS of web sites about fractals, the Mandelbrot Set, etc. This is just a tiny sample. For more comprehensive listings, try dmoz.org or Yahoo.
Thanks for checking out JManEx. Send me comments in my guestbook.Mandelbrot Set and Julia Set Tools/Viewers
JManEx - the home page for JManEx, the simple tool you are reading about here!Fractint - massive, very full-featured fractal explorer for DOS/Windows
Flarium24 - a collection of programs for various kinds of fractals
Fractal eXtreme - A shareware product for Windows from Cygnus
Black Saturn - A Java Mandelbrot applet
Fractal Domains - fancy fractal explorer for the Macintosh
Mandelbrot and Julia Mathematics
Julia & Mandelbrot Set Bibliography - Books and papers about them, mostly technical.Fractal Geometry of the Mandelbrot Set - On-line course notes?
(Part 1 and Part 2)The Mandelbrot and Julia Sets - academic notes from SUNY Binghamton
Books
B.B. Mandelbrot, The Fractal Geometry of Nature, W H Freeman & Co, 1988.
[ISBN: 0716711869]H. Peitgen and P. Richter, The Beauty of Fractals, Springer Verlag, 1988.
[ISBN: 0387158510]H. Peitgen et al, Chaos and Fractals: New Frontiers of Science, Springer Verlag, 1992.
[ISBN: 0387979034]