Amateur Astronomical Spectroscopy:
|
Introduction
Spectroscopy had its beginnings in the later half of the 19th century where it was primarily the domain of the amateur working out of his private observatory. As we entered the 20th century with a greater emphasize on astrophysics, this area of research shifted toward the professional astronomer working out of world-class observatories. This shift was primarily driven by the increasing costs and skills required to do state-of-the-art spectroscopy and the requirement for large telescopes due to film based detection of a spectrum. Once again we are experiencing a shift where the amateur can make contributions to the area of spectroscopy. This is due to both the use of more sensitive CCD detectors and the recent availability of powerful and versatile spectrometers aimed at the amateur community. I will focus on the instrument produced by Santa Barbara Instrument Group (SBIG), the Self-Guided Spectrometer (SGS). In the past, due to the limitations of film based detection and amateurs were limited to obtaining spectra of only the brightest stars and nebulae. The SGS allows spectra to be obtained with only modest aperture instruments of stars down to 10-12th magnitude.
Equipment
My primary instrument for spectroscopy and the evaluation of the SGS is a Celestron 14, which has had a Byers retrofitted drive system. The spectrometer is linked to the telescope with a focal reducer giving a final f6 ratio. The CCD camera attached to the spectrometer is the SBIG ST-7E with 9-µm pixel size. The SGS instrument appeared on the market during the later half of 1999 and was aimed at a sub group of amateurs with special interest in the field of spectroscopy [1]. The instrument is shown in Figure 1 with a number of features pointed out and the path of light indicated.
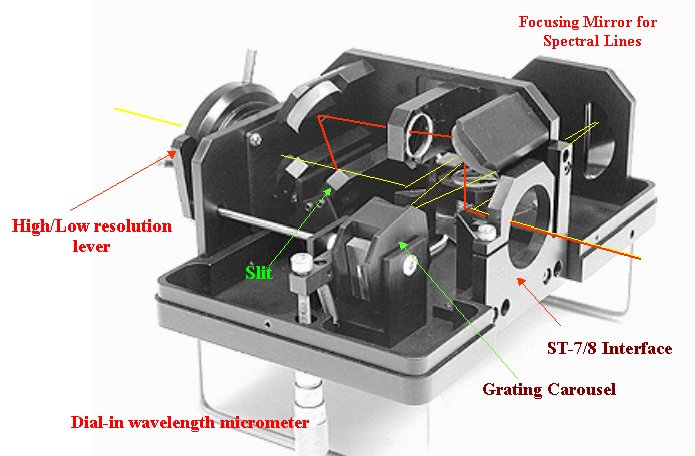 |
Figure 1.
The Santa Barbara Instrument Group Self-Guiding Spectrometer
showing various features of the instrument and the optical path. The yellow
(lighter) path shows the route followed by light passing through the slit to
the grating and ultimately to the imaging chip of the ST-7/8 camera. The red
(heavier line) path is the route followed by the light not passing through
the slit and ending at the guiding chip of the same camera.
(Click on image for enlarged illustration.) |
The SGS features a dual grating carousal, which, with the flip of a lever, allows dispersions both in the low-resolution mode (~4 Angstroms/pixel, ~400 Angstroms/mm) or higher resolution mode (~1 Angstrom/pixel, ~100 Angstroms/mm). In the low-resolution mode, about 3200 Angstrom coverage is obtained whereas in the high-resolution mode, about 800 Angstroms. The particular region of the spectrum is determined by a micrometer dial and is set by the user. The overall wavelength range of the unit is from approximately 10000 to 3500 Angstroms. Spectra are obtained using CCDOPS software and are analyzed using the software package SPECTRA, both software packages from SBIG, which allows for wavelength calibration. Wavelength calibration was carried out using emission lines from Hydrogen and/or Mercury gas discharge tubes. These tubes along with many others are available from Edmund’s Scientific. The light from these standard lamps is fed to the spectrometer by means of fiber optic leads into an opal window at the bottom of the spectrometer. This window has been modified slightly by the author such that the fiber optic lead remains permanently in position, as does their position at the source emission tubes. Spectral images obtained were further processed using MaxIm software package [2].
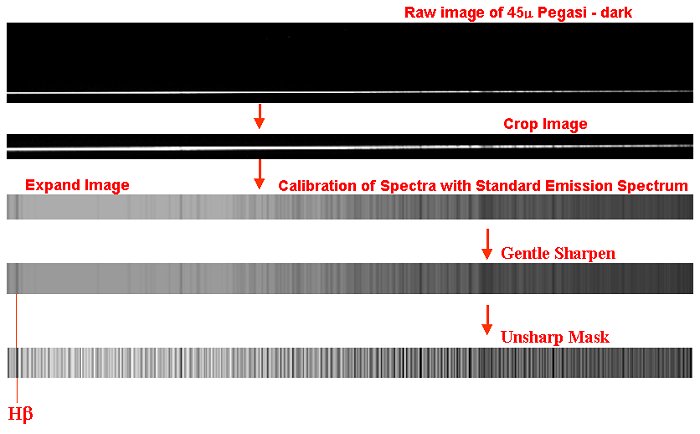 |
Figure 2.
Example of processing steps involved in spectral analysis. The raw spectrum
is only a few pixels wide and is initially processed as with any digital image
with a dark frame subtraction. The image is then cropped into a 765 by 20 pixel
swath, which allows it to be imported into SPECTRA software. The image is then
expanded and calibrated with known emission lines from gas discharge tubes.
Alternatively, the calibration can be carried out directly on the spectral
features, provided that at least two lines can be identified. The expanded
spectrum can be further processed to highlight subtle line features.
(Click on image for enlarged illustration.) |
 Figure 3. Flux calibration of spectra. A. Digital flux calibration data for standard stars is downloaded from appropriate database and is given as magnitudes per wavelength interval. This is converted to photons/cm2/sec/nm using the formula F |
Once the calibration has been carried out and a set of normalizing values obtained, these values can be used indefinitely as long as your set up remains unchanged. If simple identification of absorption or emission lines is all that is required, flux calibration can be eliminated. However, if more robust analysis of the data is to be carried out, flux calibration is essential. For example, in order to determine temperatures and electron densities in emission nebulae, flux calibration is required since a careful determination of line intensity ratios are needed for these type calculations. This type of analysis will be demonstrated later in this paper.
Results and Discussion
The low-resolution mode is useful for stellar classification and obtaining spectra of planetary nebula. In the high-resolution mode, many absorption lines are visible of atoms, ions and simple molecules.
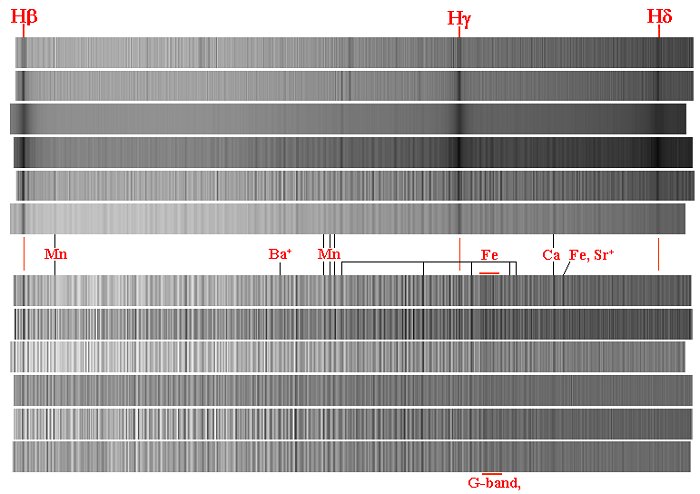 |
Figure 4.
Classification of stars based on their Spectra. Spectra were obtained in the
high-resolution mode from H (Click on image for enlarged illustration.) |
 |
Figure 5.
Graphical representation of the spectral sequence centered around the
H-gamma absorption line. Note how the intensity of the H-gamma line, which has been
normalized to 1 for all spectra at 4380 Angstroms, increases to a maximum
at type A stars and gradually falls off with cooler stellar types. Several
lines for iron (Fe) and chromium (Cr) are also identified.
(Click on image for enlarged illustration.) |
 |
Figure 6.
Spectrum of planetary nebula NGC 7009 (Saturn Nebula). In the upper left
corner the positioning of the slit is indicated. The low-resolution spectra
is shown as both a graph and an emission line profile. The high resolution
spectrum is shown in the upper right centered around the H (Click on image for enlarged illustration.) |
In addition to identifying emission features, other physical features of a nebula can be determined such as the temperature (T) and electron density (Ne). Theoretically derived equations have been obtained which relate electron density and temperature to line ratio intensities as seen in equations 1 and 2.
- (I4959 + I5007)/I4363 = [7.15/(1 + 0.00028Ne/T1/2)]1014300/T
- (I6548 + I6584)/I5755 = [8.50/(1 + 0.00290Ne/T1/2)]1010800/T
- [(I6548 + I6584)/I5755]7.15x1014300/T – [(I4959 + I5007)/I4363]0.82x1010800/T =
0.9[(I6548 + I6584)/I5755] [(I4959 + I5007)/I4363]
When the spectrometer is used in high-resolution mode, many absorption features can be observed in the spectra, particularly in cooler stars. Simple image processing techniques enhance these features making identification if features much easier. Figure 7 shows the high-resolution spectra of 78 Virginis, an Ap type star which exhibits enhanced quantities of Europium (Eu), Chromium (Cr) and Strontium (Sr) in its outer atmosphere. A few of the many lines have been identified and are labeled in the spectrum. Iron, Barium and Chromium are dominant features. The identification of species responsible for the observed absorption lines remains somewhat of an art. The Chemistry and Physics Handbook lists over 21,000 lines between wavelengths of 3600 and 10000 Angstroms for all the elements. This represents on average about six lines per Angstrom wavelength interval. Since the instrument is only at best able to resolve 1-2 Angstroms in the higher resolution mode, some criteria must be used to eliminate many of the potential lines observed or as often the case, a line may represent a blend of two or more lines.
The presence and intensity of a feature, due to an atom or ionic species, is the result of many parameters such as natural abundance, probability of the absorption, temperature, density and pressure. For our purposes, the first three are the most important. Many potential features can be eliminated at the start simply because the natural abundance of an element is so low. For example, the H
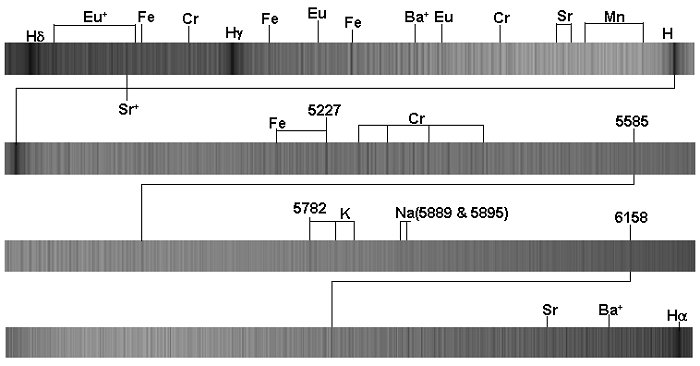 |
Figure 7.
The optical spectrum of 78 Virginis, an Ap star of the Europium-Chromium-Strontium
class. These type of stars exhibit enhanced abundance’s of these heavy metals and
the identification of absorption lines are labeled along with the identification
of more common metal lines such as Iron (Fe), Sodium (Na) and Potassium (K). The
numbers indicate the wavelengths of selected absorption lines in Angstroms.
Eu = Europium, Cr = Chromium, Sr = Strontium, Ba = Barium.
(Click on image for enlarged illustration.) |
 |
Figure 8.
Wolf-Rayet star HD 190918 (type WN) associated with NGC 6888, the Crescent
Nebula. Note the strong, broad lines of ionized Nitrogen and Helium
in emission, typical of these type stars.
(Click on image for enlarged illustration.) |
 |
Figure 9.
Wolf-Rayet star HD 165763 (type WC). Notice the distinguishing feature of
these stars, the emission lines of multi-ionized states of Carbon and Oxygen.
The wavelength range spans from 3420Ĺ at the upper left to 9730Ĺ in the
lower right.
(Click on image for enlarged illustration.) |
 |
Figure 10.
The spectra of R And, an S3.5e-S8.8e (M7e) Mira type variable star with a
period of 409 days. The upper spectrum runs from 4100 Angstroms to 4900
Angstroms while the bottom spectrum runs from 5800 to 6600 Angstroms.
Note the presence of emission lines for
H (Click on image for enlarged illustration.) |
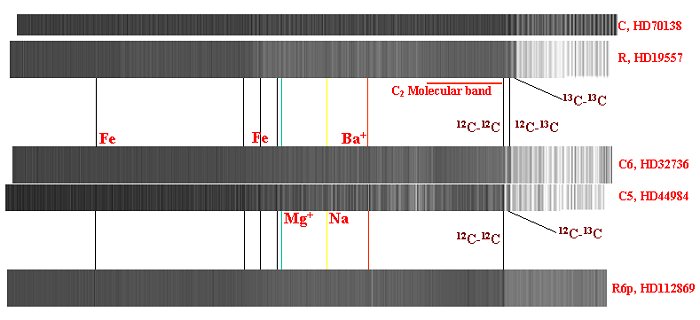 (Click on image for enlarged illustration.) | Figure 11. Spectra of type C and R stars containing varying ratios of 12C to 13C. These stars are noted for their large quantities of carbon as observed with diatomic carbon. The solar system value for this ratio 80. The upper pair of spectra represents stars with ratios in the area of 10. All three possible combinations of C-C is observed, 12C-12C, 12C-13C and 13C-12C. The middle pair represents stars with higher ratios such that the 13C-12C is no longer observed and finally for stars approaching solar system ratios, only 12C-12C is seen (lower spectrum. The blanketing effect of diatomic carbon is shown along with the identification of several metal lines. |
Future Directions
The future is certainly bright for amateur spectroscopy. As far as the SGS is concerned, future versions will offer the option of having a higher dispersive grating (1800 lines/mm). As of this writing, September 2001, this option will be available within the next few months. This will improve in the identification of lines by spreading the spectrum out by a factor of three compared to the current high-resolution grating. In addition, user friendly and versatile software for the amateur spectroscopist would be most welcome. While IRAF is the current standard for this type work among professionals, it’s requirement of a Unix or Linux operating system along with what I understand to be a difficult package to learn at best will make this system little used by the budding spectroscopist. To this end, perhaps the spectroscopy module currently being developed by Axiom to be part of the MIRA software package will fill the void.
Conclusions
The Santa Barbara Instrument Group Spectrometer represents a quantum leap forward for the amateur interested in the fertile area of spectroscopy. Even with a relatively small telescope, this instrument coupled to sensitive CCD cameras and utilizing the self-guiding feature of the ST-7/8 camera allows one to reach unprecedented magnitudes and carry out spectral analysis only dreamed of by the amateur a few years ago. Even after using the instrument for a year, I remain astounded at the fact that an amateur with only relatively modest equipment from his own backyard can detect Technetium, many dozens of other elements, simple molecules and Carbon isotopes in stars or nebulae hundreds of light years away!
References
[1] SBIG web page www.sbig.com
[2] MaxIm, Cyanogen Productions Inc., www.cyanogen.com
[3] Handbook of Chemistry and Physics, 79th edition, 1998-1999, section 10-1 to 10-88.
[4] Getting the most from a CCD Spectrograph, S. Kannappan and D. Fabricant, S&T, 100(1), 125-132, 2000.
[5] Optical Astronomical Spectroscopy, C.R. Kitchin, Institute of Physics Publishing Ltd, 1995.
[6] Astrophysical Formula, K.R. Lang, Springer-Verlag, 2nd edition, 1980.
[7] The Classification of Stars, C. Jaschek and M. Jaschek, Cambridge University Press, 1987.
About the Author
Dale E. Mais - Mais Observatory
15219 Cool Valley Rd., Valley Center, CA 92082
Email: dmais@ligand.com Website: members.cts.com/cafe/m/mais/
Dale has been involved in amateur astronomy most of his life. He is an Endocrinology researcher working for a Bio-Tech company in the San Diego area. While his biology and chemistry degrees serve him well in his professional life, it is his chemistry backgound, which he is enjoying as applied to spectroscopy. He is fortunate to have an observatory with a Celestron 14 as his primary instrument, CCD cameras and an AstroPhysics 5.1 inch (which he waited patiently for 2 years to obtain). His location of 12 miles from Mount Palomar means he benefits from the outstanding seeing, and relatively dark skies which the Hale telescope benefits from. His primary interest is spectroscopy and its application toward understanding the composition and other physical parameters of astronomical objects. In particular, he is doing a spectroscopic survey of C and S type stars, which often has abnormal heavy metal and/or isotope composition compared to solar system values. In addition, he is interested in quantitation of atomic/ionic species in stellar atmospheres.
- Ed. BDM