ITOFS is a simulation which mimics the system development process in a small Information Systems department. It contains elements of repeated project assignment with associated code generation and testing. It provides a capability to hire new personnel, and to devote resources toward improvements in such areas as technology and process improvement. You should have already downloaded the ithink runtime engine and the ITOFS model (right mouse click).
While there are many sub-objectives, the primary objective of the simulation is to produce the highest efficiency rating where:
Efficiency Rating = Finished Delivered Source Instructions (DSI) / Cumulative Productivity FactorIn this simulation Cumulative Productivity is based upon Test Productivity and Development Productivity. These measures are affected immediately by almost 20 other variables. That is, how productive your programmers are depends upon the complexity of the challenge, how up to date their computer resources are, how well trained they are, how much schedule pressure they are under, etc. etc. And each of these 20 variables may be affected by many other variables.
Attempting to find an "optimal" solution as the software code development moves through time is an intractable problem. Solving a complex problem like this requires the use of Nth Order nonlinear differential equations.This complexity is not something you can mentally solve, nor solve using sophisticated analytical mathematical formulas, simply because there are many solutions. Your focus as a simulation user should be upon understanding the relationships among all the variables and upon observing the long wave cycles in software production, not upon finding the "best" answer..
The simulation covers a total of 600 days. It is paused every 60 days to allow the user to;
1) accept or reject new project proposals and ,At the start of the simulation there are 16,000 DSI in the pipeline.
2) make adjustments in the available control mechanisms.
To aid in the simulation operation, control of the adjustable levers is divided among three team members.
1) The Chief Information Officer (CIO) receives new project proposals, must decide whether to accept or reject them. Sometimes the proposals are required, other times they are optional. The specific levers the CIO controls are Accept Project, Project Business Value, Project Complexity, and Project Size. The last three must be adjusted each 60 day period.Your team must work together to plot out a strategy for meeting the requirements that are presented to them. If you are working the simulator in a distributed mode, each participant will need to act as a technographer or person who sets the controls and runs the simulation.2) The Project Team Leader makes decisions about hiring, testing, and schedule slippage. The specific levers he/she controls are How Many to Hire, Test Fraction, and Push Deadlines.
3) The Staff Administrator invests in overall measures for improving the development environment. Levers under the administrators control include Investment in Training, Process, Measurement, and Technology.
As the CIO, each period you will be provided a new set of possible projects to accept. You must decide which projects, if any, you will pursue. The first time the simulation is operated beginning to end you should set:
Frequency of Project = 60 daysEach period you will draw a "card" such as:
Stop the Projects = 600 days (i.e. they do not stop)
Period 2
DSI Complexity Business ValueNote: You must accept one of these projects Note: Future requirements look light at this time |
![]()
As the simulation proceeds, write down your decisions in the table
below.
|
Period
|
Accept Project
|
Project Size (DSI)
|
Project
Complexity |
|
|
|
|
|
|
|
|
|
|
|
|
|
|
|
|
|
|
|
|
|
|
|
|
|
|
|
|
|
|
|
|
|
|
|
|
|
|
|
|
|
|
|
|
|
|
|
|
|
|
|
|
|
|
|
|
|
|
|
|
|
|
|
| Period 1 | Period 2 | Period 3 | Period 4 | Period 5 |
| Period 6 | Period 7 | Period 8 | Period 9 | Period 10 |
Once the CIO has committed the MIS group to a set of projects, you must then attempt to work the specific projects through to completion. To this end you have three general factors under your control - hiring, testing, and slipping the deadlines.
How Many to Hire
As seen below, there are two classes of employees - rookies and pros.
Initial productivity for a Pro is 60 Delivered Source Instructions (DSI)
per day. It takes 40 days for a rookie to become a pro. Rookies produce
work at 1/2 the rate of Pros. Pro's resign at a 20% annual rate. Pro's
spend 20% of their time training rookies. You have 2 rookies and 6 pros
to start. You may add to this the first period. Print out the following
table and keep track of the decisions you make here.
|
|
|
|
|
|
|
|
|
|
|
|
|
|
|
|
|
|
|
|
|
|
|
|
|
|
|
|
|
|
|
|
|
|
|
|
|
|
|
|
|
|
|
|
|
|
|
|
|
|
|
|
|
|
|
|
|
|
|
|
|
|
|
|
|
|
|
|
||||
Rookies and Pros may be assigned to either Development or Testing. The Test Fraction Slider bar dictates the percentage to be assigned as Testers. See detail definition for Test Fraction. Not testing will seriously degrade the number of completed DSI.
Push Deadlines
You have the option of pushing back the deadlines which are established
by a combination of business value, amount of integration and test, and
overall productivity. Pushing the deadlines back will mean that less code
will be completed on time. This will create negative customer reaction,
and a loss of business value.
As the primary administrator, you may invest in the improvements outlined
below. In the long run these time based investments will have a positive
effect upon your staff's production. Initially however, you will lose some
productivity due to 1) employee time spent away from regular production
and 2) the learning curve for bringing the improvements into your environment.
Refer to the definitions for specifics on the effects of the lever control
operation.
|
|
|
|
|
|
|
|
|
|
|
|
|
|
|
|
|
|
|
|
|
|
|
|
|
Print out and keep track of the decisions you make from period to period
in this table:
|
|
|
|
|
|
|
|
|
|
|
|
|
|
|
|
|
|
|
|
|
|
|
|
|
|
|
|
|
|
|
|
|
|
|
|
|
|
|
|
|
|
|
|
|
|
|
|
|
|
|
|
|
|
|
|
|
|
|
|
|
|
|
|
|
|
|
|
|
|
|
|
|||||
As the technographer you are responsible for setting the levers based upon the instructions given to you by the CIO, Project Manager, and Staff Administrator. If the simulation is being conducted in a distributed mode, then each participant will need to act as the technographer. The technographer is also typically responsible for guiding the group through the output produced each period.
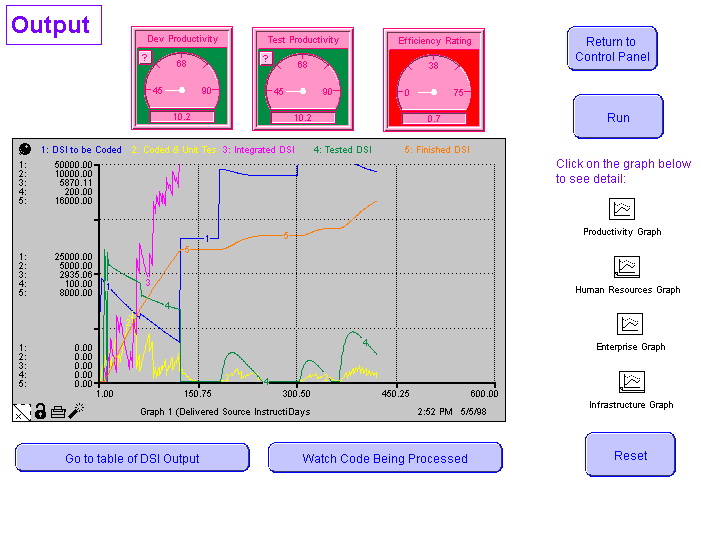
There are two main screens. The first, "Input Screen" provides the capability to key in the decisions by dragging slider bars back and forth. The second, "Primary Output Screen" portrays a graph with progress in code development, a gauge which monitors the efficiency rating and four other sub-graphs. The four sub-graphs portray productivity, human resources, enterprise and infrastructure information respectively. Click on the small graph icons to open them up. The blue button(s) at the top right on each screen provide you with the ability to maneuver among the views.
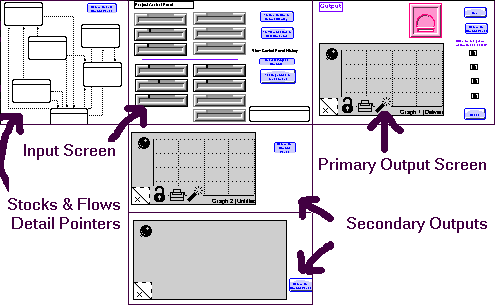
Figure 1. The User Interface
The Stocks and Flows Detail Pointers provide you an avenue to enter into the "guts" of the model. Caution should be exercised when venturing down in this area. It is easy to get lost! But this is also a valuable area to discover relationships between the factors in your simulation.
Control Levers - Information Technology Flight Simulator
The diagram below shows you the levers you will have to control. The CIO will control those decision levers above the dotted line, the project manager will control those on the bottom left, and the staff administrator controls those on the bottom right.
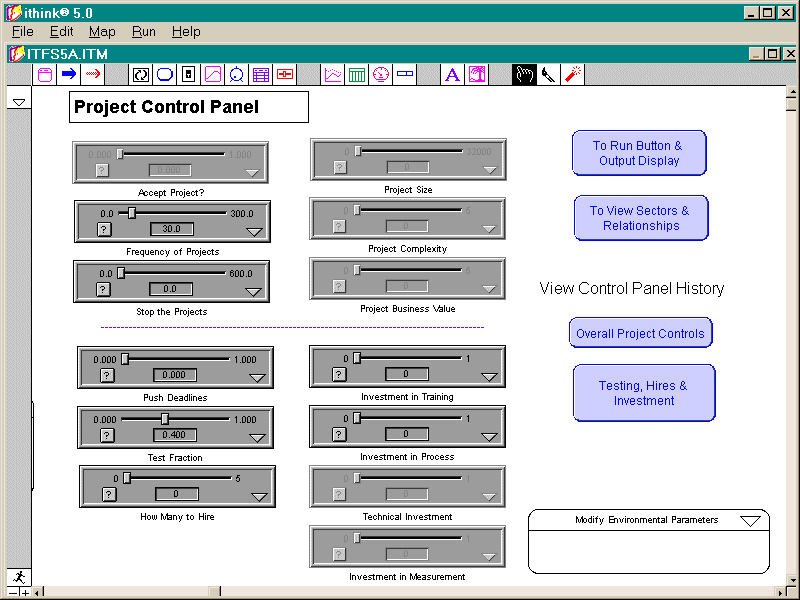
Figure 2. User Control Levers
Corporate Level Decisions
Accept Project - When a new project is assigned, the user has the choice of accepting it or not. The default for this value is 0 and the user sets it to 1, thus letting the new project data flow into the model entities. The user must move this slider to 1 to accept a new project.Project Manager/User DecisionsFrequency of Projects - The user can set how often new projects should be assigned. For example, setting this slider to 50 would cause a new project to appear every 50 days.
Stop the Projects - The user can define when the new projects should stop being assigned. For example, if frequency is set to 50 and this slider is set to 201, then new projects will appear at day 50, 100, 150 and 200. After that, no new projects will appear.
Project Size - When a new project is assigned, you have the option of modifying the size of the project by adjusting this slider.
Project Complexity - With this slider, the user can adjust the complexity value for a new project. Leaving it at 0 will cause the randomly generated value to be used (this is the one displayed).
Project Business Value - With this slider, the user can adjust the business value for a new project. Leaving it at 0 will cause the randomly generated value to be used (this is the one displayed).
Push Deadlines - Allows the user of the model to alleviate schedule pressure by pushing the deadlines on the projects that are currently being developed. This slider has a linear effect on schedule pressure, i.e., setting it to 0.5 will cut schedule pressure by 50%.Staff Administrator DecisionsTest Fraction - The user can specify what percentage of the work force should be doing testing. The default is 0.4 or 40% do testing.
How Many to Hire - The user can define how many new rookies to hire anytime during a simulation.
Investment in Training - This slider allows the user to invest in a training program. Set it to a percentage which indicates what part of your staff will participate in this initiative. For example, setting it to 0.5 means 50% of your staff will be involved. Thus, 50% will not be involved in project activities for the next couple weeks and once they are back, this 50% will have a lower productivity due to their additional activities. Eventually, this investment should cause an increase in productivity.Primary Output ScreenInvestment in Process - This slider allows the user to invest in a process design program. Set it to a percentage which indicates what part of your staff will participate in this initiative. For example, setting it to 0.5 means 50% of your staff will be involved. Thus, 50% will not be involved in project activities for the next couple weeks and once they are back, this 50% will have a lower productivity due to their additional activities. Eventually, this investment should cause an increase in productivity.
Technical Investment - This slider allows the user to invest in a technical upgrade of hardware or software. Set it to a percentage which indicates what part of your staff will participate in this initiative. For example, setting it to 0.5 means 50% of your staff will be involved. Thus, 50% will not be involved in project activities for the next couple weeks and once they are back, this 50% will have a lower productivity due to their additional activities. Eventually, this investment should cause an increase in productivity.
Investment in Measurement - This slider allows the user to invest in a measurement program. Set it to a percentage which indicates what part of your staff will participate in this initiative. For example, setting it to 0.5 means 50% of your staff will be involved. Thus, 50% will not be involved in project activities for the next couple weeks and once they are back, this 50% will have a lower productivity due to their additional activities. Eventually, this investment should cause an increase in productivity.
Cumulative Productivity is a measure which takes into account both the amount of finished product (DSI) and the level of production per employee. It is computed as follows:
Finished DSI / (.5 * (Development Productivity + Test Productivity) / 60 * TIME)
The output screen which follows is what allows the user to follow the results of their decision making. Each of the sub graphs allows the user to folllow particular areas of sub-development.
This diagram shows how the code moves through the system. Needed project
code comes in through the door and resides in the DSI to be Coded bucket.
Programmers write the code and it then moves into Coded & Unit Tested
stock. The software is then integrated with other modules, and then moves
on to testing. If it fails testing it moves back to be re-coded. If it
passes testing, it is moved into finished.
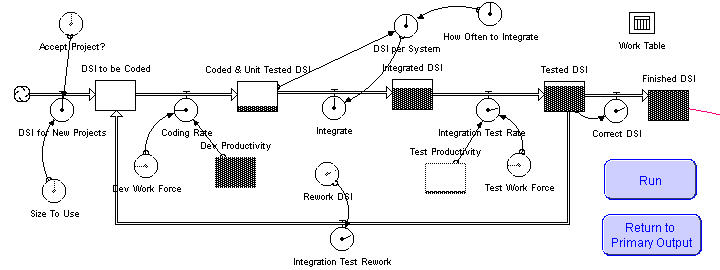
Figure 3. Flow of Computer Code (Delivered Source Instructions)
This diagram shows a portion of those items which affect productivity. You can see some of the items affecting each of the types of productivity. These include schedule pressure, infrastructure effects (e.g. quality of computers), complexity of the task, and number in the work force.
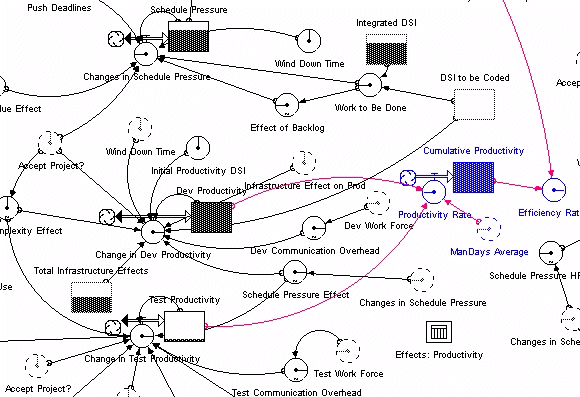
Figure 4. Productivity Measures
Traditional v. System ThinkingHopefully this exercise will help you think more about how observing operations dynamically versus statically provides a superior viewpoint for decision making. The table below contrasts traditional ways of meeting challenges versus systems thinking.
Traditional                          Systems Thinking

Static Thinking - Focusing upon      Dynamic Thinking - Framing a problem
particular events                    in terms of a pattern of behavior
                                     over time

System-as-Effect Thinking - Viewing  Systems-as-Cause Thinking - Placing
behavior generated by a system as    Responsibility for a Behavior on
driven by external forces            internal actors who manage the
                                     policies and plumbing of the system

Tree by Tree - believing that        Forest Thinking - Believing that to
really knowing something means       know something you must understand
focusing upon the details            the context of relationships

Specific Factors Thinking - Listing  Operational Thinking - Concentrate
Factors that influence or are        on getting at causality and
correlated with some result          understanding how a behavior is
                                     actually generated

Straight Line Thinking - Viewing     Closed Loop Thinking - Viewing
causality as only running one way,   causality as an ongoing process, not
with each cause independent from     a one time event, with the effect
all other causes                     feeding back to influence the
                                     causes, and the causes affecting
                                     each other.

Measurement Thinking - Searching     Quantitative - Accepting that you
for perfectly measured data          can always quantify, although you
                                     can't always measure

Proving Truth Thinking - Seeking to  Scientific Thinking - Recognizing
prove models to be true by           that all models are working
validating with historical data      hypotheses that always have limited
                                     applicability
Source: Richmond, Barry. "The Thinking in Systems Thinking: How Can We Make it Easier to Master." The Systems Thinker. Vol. 8 No. 2, March 1997.